
How a self-learning supply chain cut 285,000 barrels of oil per year
The IKEA catalogue has an energy footprint the size of South Carolina's economy. The question was not how to print less, but how to make the supply chain learn.
Key result
By FY16: 28% CO2 reduction per copy, 484 GWh energy saved (145,000 Swedish households), 19,000 tons CO2 cut. Cost-benefit ratio over 200:1.
Every year, more than 200 million IKEA catalogues roll off presses around the world. The paper supply chain behind that print run involves forestry operations, pulp mills, paper manufacturers, printers, and logistics networks spanning dozens of countries. Its annual energy consumption rivals the economy of South Carolina. When Inter-IKEA asked how to reduce the environmental footprint of that chain, the instinct was to look for the largest single source of waste and attack it.
That instinct is understandable. It is also wrong. A supply chain of this scale is not a pipeline with a leak. It is a system with feedback loops, time delays, and actors operating on different incentive structures. Fixing one node shifts pressure to another. Optimizing one variable degrades a second. The only way to produce durable improvement is to make the system itself capable of learning.
Mapping the full lifecycle
The engagement began not with a solution but with a map. The team traced the full lifecycle of the catalogue: from forest to pulp mill, from mill to paper manufacturer, from manufacturer to printer, from printer to retail store, from store to consumer, from consumer to waste stream. At each transition, energy enters the system, materials transform, information flows (or fails to flow), and decisions get made by different actors with different goals.
Most supply chain analyses stop at the boundaries of the organization's direct control. This one did not. Because the environmental footprint of the catalogue lives overwhelmingly in the upstream chain, in forest management, pulping chemistry, energy sourcing at mills, the analysis had to extend beyond IKEA's procurement contracts into the operational realities of its suppliers' suppliers.
What emerged was not a ranked list of hotspots. It was a dynamic model of how energy and materials moved through the system, where information bottlenecks prevented good decisions, and where the relationships between actors created structural incentives that worked against efficiency.
The dashboard as a learning engine
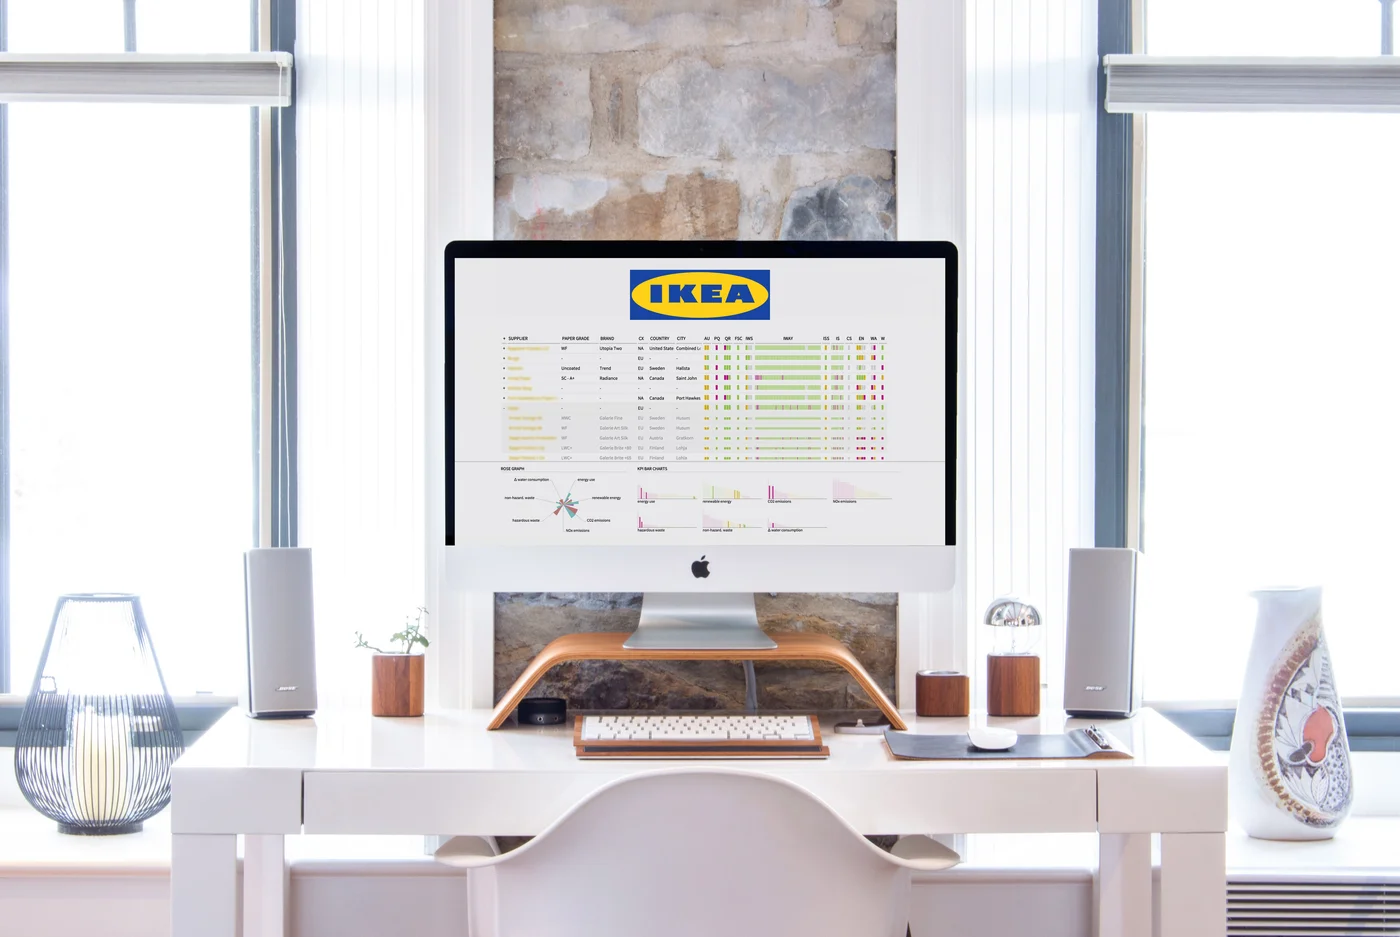
The core intervention was not a new material, a new process, or a new policy. It was a data architecture. The team built interactive dashboards that gave purchasers, suppliers, and retailers visibility into the environmental performance of their specific segment of the chain, contextualized against the whole.
This matters because the bottleneck in most supply chains is not technical capacity. It is information asymmetry. A paper mill operator in Scandinavia makes decisions based on local cost and throughput data. A purchaser in Delft makes decisions based on price and delivery schedules. Neither sees how their choices interact to produce system-level outcomes. The dashboards closed that gap. They translated lifecycle data into decision-relevant formats for each actor in the chain.
The design was intentional: the system was built to learn. As suppliers changed practices, the dashboards updated. As new data entered the model, the relationships between variables became clearer. The supply chain began to optimize itself, because each participant could see the consequences of their decisions in the context of the whole system.

In the first year, the catalog's energy consumption dropped 8%, while CO2 emission went down 2%. That may sound modest, but with a print run that has an energy footprint the size of the entire South Carolina economy, this adds up to 285,000 barrels of oil left in the ground each year.Matthieu Leroy, Sustainability Specialist, IKEA Media Production
Why the reductions accelerate
An 8% energy reduction and 2% CO2 reduction in year one sound modest until you calculate the absolute numbers: 285,000 barrels of oil left in the ground annually, and the equivalent of 155,000 car kilometers of CO2 compensated. But the more important fact is that these reductions were accelerating. The system was learning faster as it accumulated data.
By FY16, the cumulative results told a different story. CO2 emissions per catalogue copy had dropped 28%. Energy consumption per copy fell 5%. Renewable energy use across the supply chain increased 30%. Water consumption diminished 35% in a single year, simply by selecting suppliers with lower water footprints. The total energy savings reached 484 GWh, enough to power 145,000 Swedish households. CO2 emissions dropped by 19,000 tons, equivalent to 20% of Belgium's annual emissions.
All of this for a total project cost of less than US$500,000. The cost-benefit ratio exceeded 200:1 for the energy savings alone.
Four tools, one system
The intervention produced four distinct instruments, each designed for a different actor in the chain.
The Purchaser Dashboard gave IKEA's buying teams an instant visual overview of every supplier's performance across 18 KPIs distilled from over 100 sustainability, quality, and economic metrics. Color-coded bars made comparison intuitive. Mouse-overs revealed granular data. For the first time, a purchasing manager in Delft could see how a paper mill in Finland compared to one in Brazil across energy, water, waste, and emissions, all in the time it takes to scroll a page.
The Supplier Brief was an anonymized version of the same data, shared with suppliers. Each supplier could see where they stood relative to their competitors and IKEA's sustainability targets. This created what one manager called "a supplier race": suppliers competing not on price alone but on environmental intelligence. Several suppliers used the brief to make the case for capital investment to their own boards.
The Data Dashboard served internal stakeholders: co-workers, retailers, catalogue managers. It tracked 13 aspects following Global Reporting Initiative (GRI G4) standards, with history, current status, and forward targets. Users could leave comments and suggestions, turning a reporting tool into a conversation.
The Story of Print was a storytelling infographic for customer-facing staff, walking through the six steps of the catalogue lifecycle. It became part of IKEA Media Production's internal learning website and was introduced to thousands of employees.
I knew that, as a big player, IKEA had the leverage to drive a transition toward greater sustainability in our own paper and print supply chain. But this project has made us an enabler of network learning at an industry level. That is far beyond what we originally expected or imagined.None, Matthieu Leroy, Sustainability Specialist, IKEA Media Production

The systemic strategy pattern
The IKEA catalogue project illustrates a core principle of systemic strategy: the highest-leverage intervention is often not a physical change but an information change. The paper mills, the printers, the logistics operators all had the technical capacity to be more efficient. What they lacked was visibility into how their individual decisions aggregated into system-level outcomes.
In spring 2014, a dozen specialists from IKEA and Except locked themselves in Except's Rotterdam headquarters for three days. Using the Symbiosis in Development (SiD) framework, they mapped the entire supply chain and discovered the key lever. IKEA had already collected high-quality data on over 100 economic and sustainability aspects of 130 global suppliers. The data existed. It was simply too much for any human mind to process. Thousands of data points sat in spreadsheets that no one read.
The team turned that "information waste" into an information resource. Eight months later, IKEA's purchasing managers had a brand-new interface. The tools rolled out in three design rounds of four months each.
Because the IKEA catalogue is the world's most-printed publication, every improvement in its supply chain ripples through the entire global paper and print industry. The mills that serve IKEA also serve publishers, newspaper companies, and packaging manufacturers. When those mills invest in renewable energy or reduce water consumption to score better on IKEA's dashboards, every product that passes through them benefits.
The catalogue became a lever that moved an industry. The total cost was less than half a million dollars. The systemic return is still compounding.
More case studies

Designing a regenerative neighborhood from first principles
Carpet Sector: Circular Roadmap

Pizza 4P's: 15-year strategy
Ready to map your system?
Every case begins with a conversation about the system you operate in and the leverage points within it.
Book an introduction